Preparing audio…
In the world of math, there's a magical door, where numbers and chances hold stories galore. A probability distribution, they say, tells you how likely outcomes will play!
In the world of math, there's a magical door, where numbers and chances hold stories galore. A probability distribution, they say, tells you how likely outcomes will play!

Some variables are counted — like 1, 2, or 3, these are called discrete, as whole numbers they'll be. But others flow freely like water through space, those are continuous, running their race.

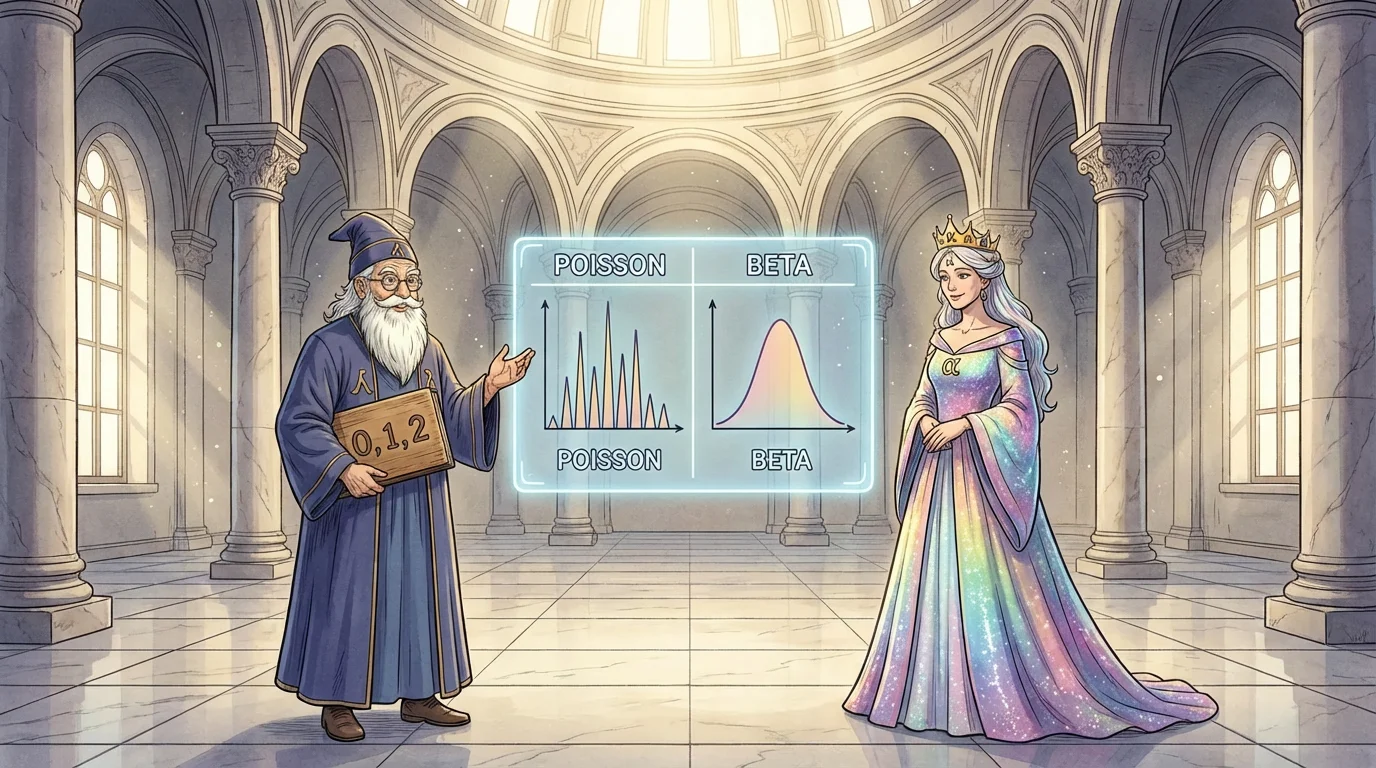
Now let me tell you of Poisson, so wise, who counts all the events right under your eyes. In a fixed little window of time or of space, he tallies the events that fall into place.

His secret ingredient? A number called λ (lambda, they say), the average of events in a typical day. If λ is 10, then ten calls come in, but sometimes it's 7 — where does counting begin?

Imagine a call center, busy and bright, ten calls every hour, from morning to night. The phones are ringing and the operators are busy helping everyone who calls.

"What if only 7 ring?" the manager cried, Poisson smiled gently and quietly replied: "Use my formula, friend, and you'll quickly see, the chance of that happening — leave it to me!"

Poisson says YES when: Cars roll on highways one by one. He counts each car as it passes by, keeping track of the traffic flow through the day.

Packages arrive 'neath the afternoon sun. Poisson stands at the loading dock, counting every box that the delivery truck brings to the door.

Earthquakes shake regions across a decade, and network packets travel down cables they've laid! Poisson tracks these rare events, no matter how big or small.

He counts all the rare things, the sparse and the few, discrete little integers — 0, 1, 2! Poisson finishes his tally, satisfied with the numbers he has found.

But wait — there's another, who works in between, the Beta distribution, a continuous queen! She lives in the kingdom of zero to one, where proportions and probabilities run.

She lives in the kingdom of zero to one, where everything is a fraction or a percentage. It is a world of smooth transitions and endless possibilities.

She's shaped by two helpers — Alpha (α) and Beta (β), these two little parameters guide her ballet. They dance around her, changing her world with every move.

Adjust them together and watch how she bends — from U-shapes to bell curves, her flexibility never ends! Beta can be anything she needs to be to fit the data.

🧪 A new drug was tested, the scientists prayed, "Will it work?" they all wondered, a little afraid. But Beta stepped forward and said with a grin, she would help them find the answer.

"20 successes, 30 failures — let's begin! I'll model your doubt as a Beta(21, 31), update as you go — the learning's never done!" Beta shows them how to grow their knowledge.

Beta says YES when: A website test asks "which version converts", elections are looming and certainty hurts, or financial models must factor in risk. She is the queen of uncertainty.
So what is the difference between the two friends? Let's rhyme out the answer before this tale ends: Poisson counts events that are integer-based, Beta models uncertainty, no time to be wasted!

Poisson helps managers plan every shift, predict when the crowds come. Beta helps scientists and marketers say "here is my best guess" and update as they view. They help us make better decisions.

Together they cover the world, near and far, discrete and continuous — both math superstars! A strong grasp of these distributions empowers you to make accurate predictions and strategic decisions.